Why to profile React Native internals? (aka Why bother?)
Some folks might ask why someone outside of Meta would profile C++ code of React Native itself... Actually, that’s a really good question! Perhaps you’ve already addressed most of your low-hanging fruit in your app and now you’re hoping to find similar improvements within the React Native codebase. Imagine React Native is a vehicle, and your React Native app is the passenger riding it. Making it go faster would also make the passengers arrive faster, right? That would indeed be a great contribution.

But there might be another, less common reason: you might want to gain a better overview and understanding of what’s happening under the hood of React Native internals. This will allow you to identify performance bottlenecks and pinpoint specific areas of the code where you can focus and perform deeper analysis with a debugger.
Regardless of your reason, welcome to today’s article on profiling React Native’s code, where I'll quickly show you how to do this with Tracy profiler!
A unified solution: Multi-platform profiling for React Native
Most of you, dear mobile native developers, are probably familiar with your tools and IDEs. You’ve likely used Xcode’s profiler to investigate performance bottlenecks in your iOS apps. Similarly, if you wanted to do the same for Android, you probably used built-in tools in Android Studio, or utilized systrace or ftrace directly.
That’s all great, but it’s not good enough for me 😉 In my previous introduction to React Native profiling, I described the differences between sampling and instrumented profilers and went over their pros and cons. Moreover, I’m extremely happy when there is a single tool that I can use to profile multiple apps on multiple platforms without bloating my laptop with extra gigabytes. The cherry on the top would be the fact that I can save such traces and process them later.
If you’ve read my last article, you already know that I’ll continue using Tracy, an open-source hybrid and remote profiler that works great for React Native optimization!
How to approach React Native profiling with Tracy?
Well, to get started, we need to download at least two things: Tracy’s and React Native’s source codes. I’ll start with the latter:
Let’s dive into React Native’s source tree, where we’ll create a new directory for Tracy. Since I would like to profile a lot of modules, the closer we are to the core, the better. My choice is ReactCommon as it is used by both Android and iOS—looks like a good candidate to me!
I’m going to create the tracy directory there and start populating it:
For simplicity sake, we will keep the all of Tracy’s source code here. Theoretically, we should be able to remove everything besides the public directory.
A bit more iOS specific steps…
Actually, we are almost done! For iOS, we need to create a podspec for Tracy, so here’s what I’ve prepared (tracy.podspec):
I’m not a CocoaPods wizard, so there are some extra workarounds that I’ve applied to cover some probably trivial issues. First, the official way to include and use Tracy profiler is by writing:
However, once you run pod install, the public headers will be placed in the tracy directory, named after your Pod, making the header be located at:
So my temporary “solution” is to create two one-line header files that would “proxy” to the correct files:
This will do the trick, so let’s carry on. I’ll update this article once I find a proper solution.
Tracy includes its headers using relative paths, so we have to maintain the structure of files within Tracy’s public directory.
Now, we can find the react_native_pods.rb file and declare our pod there. Just add this line somewhere:
We need to define the project-wide TRACY_ENABLE to enable Tracy, otherwise it will be stripped out. The value for that define does not matter, just the fact of defining it.
Building Tracy tool (server)
We also need the app that displays the collected metrics.
Test all the pieces
Ok, let’s see if everything works. Let’s keep the Tracy window open and now let’s go run the rn-tester app.
There’s no specific ritual required, such as running Tracy profiler and your app in a particular order or within some narrow time window. All you need is the IP address of the device running your app (it’s localhost if you run it on iOS simulator). Having said that, you can connect Tracy to your app at any time!
If nothing appears, then you probably built your app without defining TRACY_ENABLE note there’s no D at the end!), or perhaps the device is inaccessible from your network—while improbable, a simple ping command should verify that.
How to use Tracy profiler?
We will use Tracy by instrumenting the specific pieces of code that we are interested in profiling.
If you have a function that you would like to see in the profiler, just add ZoneScoped; at the beginning of that function. You can think of a scope as a named pair of performance markers, with some optional properties like name, color, etc. The start time is recorded when the scope is declared (thanks to RAII), and the end time is measured when it leaves the scope.
The scope created with ZoneScoped; macro will default to the name of the function it is in. However, if you’d like to override such a name with something of your choosing, then just use the ZoneScopedN(“WhateverBetterNameYouWant”) variant, which accepts a string with a custom name—an ideal choice when you have multiple scopes within a single function! Yup, you can declare multiple nested scopes within a single function!
Tracy is also a frame profiler, where “frame” can mean literally any logical unit of work. To use this feature, simply mark where the frame starts/ends using the FrameMark; macro. I personally prefer to slap this line at the end of the _jsThreadUpdate function in packages/react-native/React/Base/RCTDisplayLink.mm. Now, with this setup, we can perform frame-by-frame analysis — that's React Native performance optimization at its finest!
Which places are worth instrumenting?
Well, this is a hard question, as it depends on what you are looking for. I like to start my instrumentation from packages/react-native/ReactCommon/ReactInstance.cpp and packages/react-native/ReactCommon/react/renderer/runtimescheduler/RuntimeScheduler_Modern.cpp files. Those will show you when React Native’s event loop is running. Personally, I also go for Task.cpp and EventQueue.cpp files.
When I started my profiling I wanted to focus on rendering and layout, so I obviously went to instrument Yoga (which uses recursive calls, try calculateLayout or computeFlexBasisForChild), ShadowNode and most of the packages/react-native/ReactCommon/react/renderer/mounting/ classes—this is what you might have seen in my early X posts, like this one.
What can be profiled?
This section will briefly describe what kind of metrics you can collect and demonstrate how to do that using React Native’s code as an example.
Out of the box, the CPU usage is collected periodically for you. In the previous section, I described how to collect execution measurements of your functions.
However, I conveniently skipped over one edge case, but let’s address it now: What if the scope I’m interested in starts in one function and ends in a different one? This is considered an advanced use case (according to the docs), and for this, we would need to reach out to Tracy's C API and use the TracyCZone and TracyCZoneEnd macros.
As described in Section 3.13.3.1, we would need to manually forward the opaque “context structure” of type TracyCZoneCtx between those functions, either by function parameters, return values, or via TLS (thread-local store). This feature still has its limitations, though, such as the zone must end in the same thread in which it was started.
Lock contention
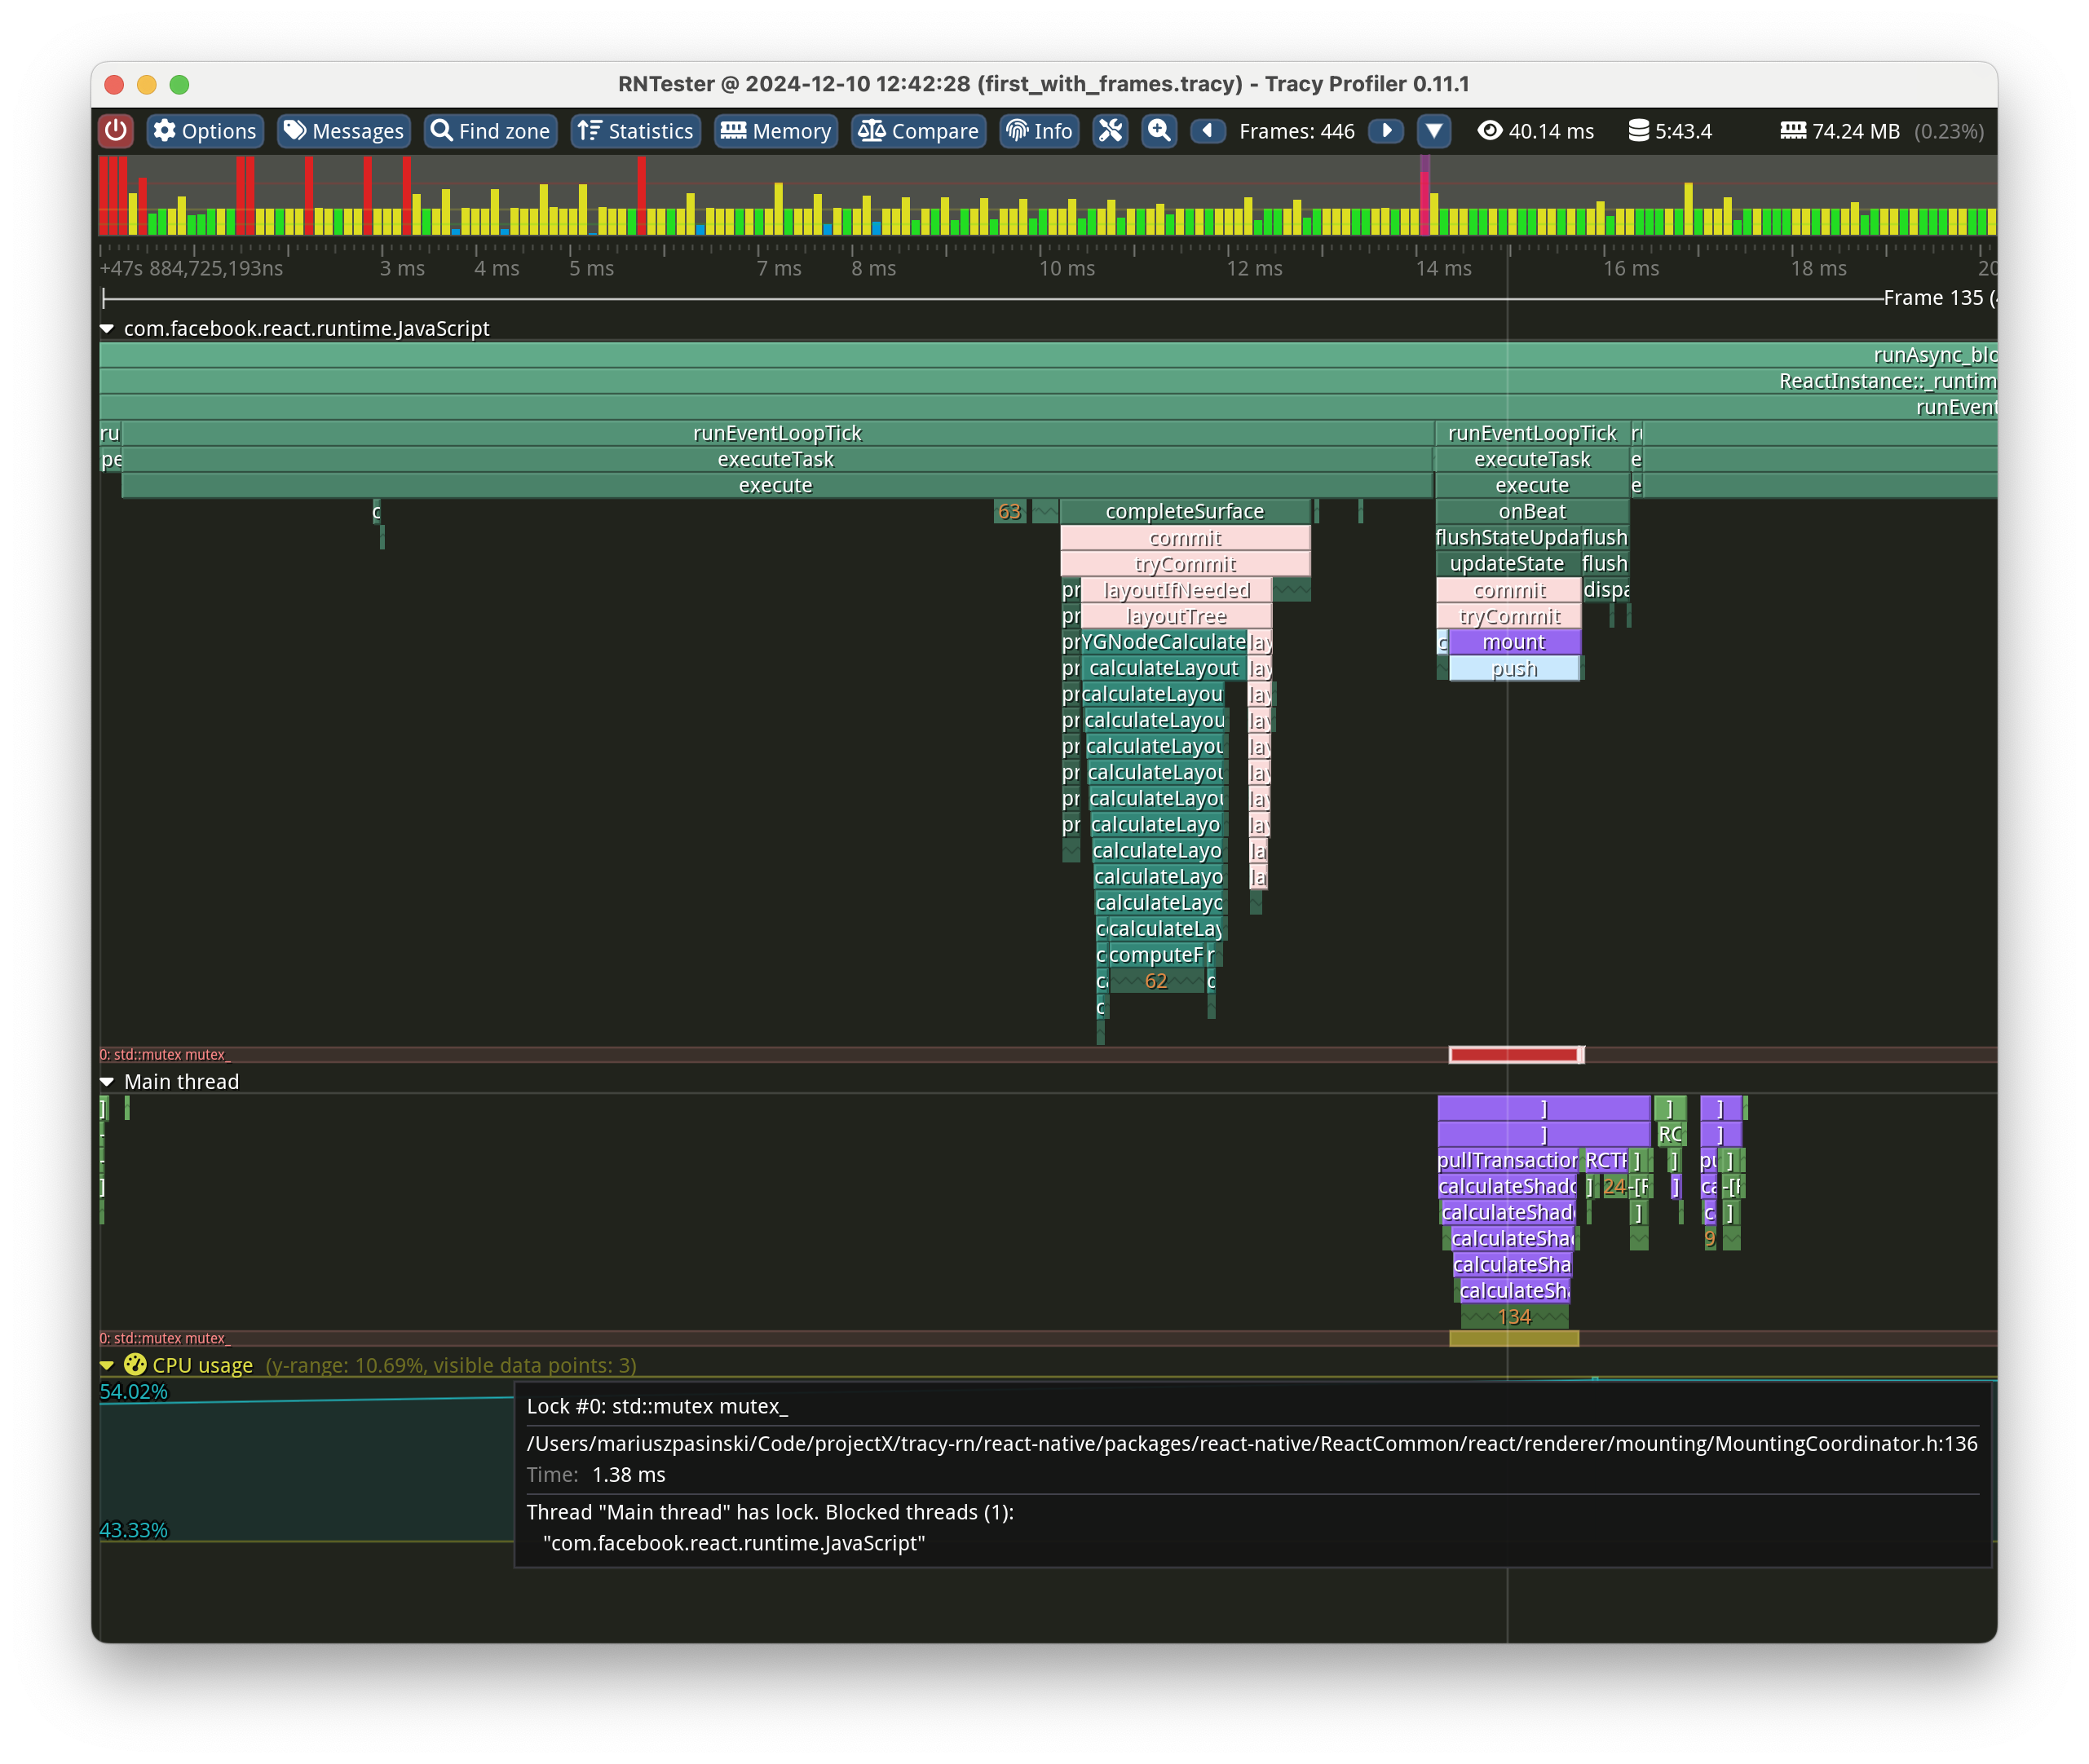
In one of the screenshots above, you might have noticed that Tracy profiler can display when locks are being… well, locked. This feature allows us to investigate lock contention issues in multithreaded applications. Naturally, Tracy by itself is not aware of the locks used in your (or any other) source code—it’s our responsibility to instrument those.
So what did I do there? I went to packages/react-native/ReactCommon/react/renderer/mounting/MountingCoordinator.h, and near the end of the class declaration, you can find this line:
All you need to do is wrap the mutex declaration with TracyLockable macro, like this:
Just don’t forget to include Tracy’s header file (it’s tracy/Tracy.hpp) 😅 After you rebuild and restart your app, you should be able to see this lock being used to synchronize MountingCoordinator’s push() and pullTransaction(). Neat!
If you are one of the lost souls who are stuck with the C++ standard before version 17, then here’s an additional step quoted straight from Tracy’s documentation:
The standard std::lock_guard and std::unique_lock wrappers should use the LockableBase(type) macro for their template parameter (unless you’re using C++17, with improved template argument deduction). For example: std::lock_guard<LockableBase(std::mutex)> lock(m_lock);
For more info, check out Tracy’s documentation, section 3.5 “Marking locks”.
Naming threads
Speaking of threads, it would be helpful to inform Tracy about all the threads that we create. While Tracy will notice that there are some threads, it's impossible to infer their purpose or name. As any other great profiler, you can give Tracy some hints and pass some labels for those threads.
In my case, I just added the same following line
to two files, namely: packages/react-native/React/CxxBridge/RCTCxxBridge.mm and to packages/react-native/ReactCommon/react/runtime/platform/ios/ReactCommon/RCTJSThreadManager.mm. Now we have proper names instead of numeric thread IDs!
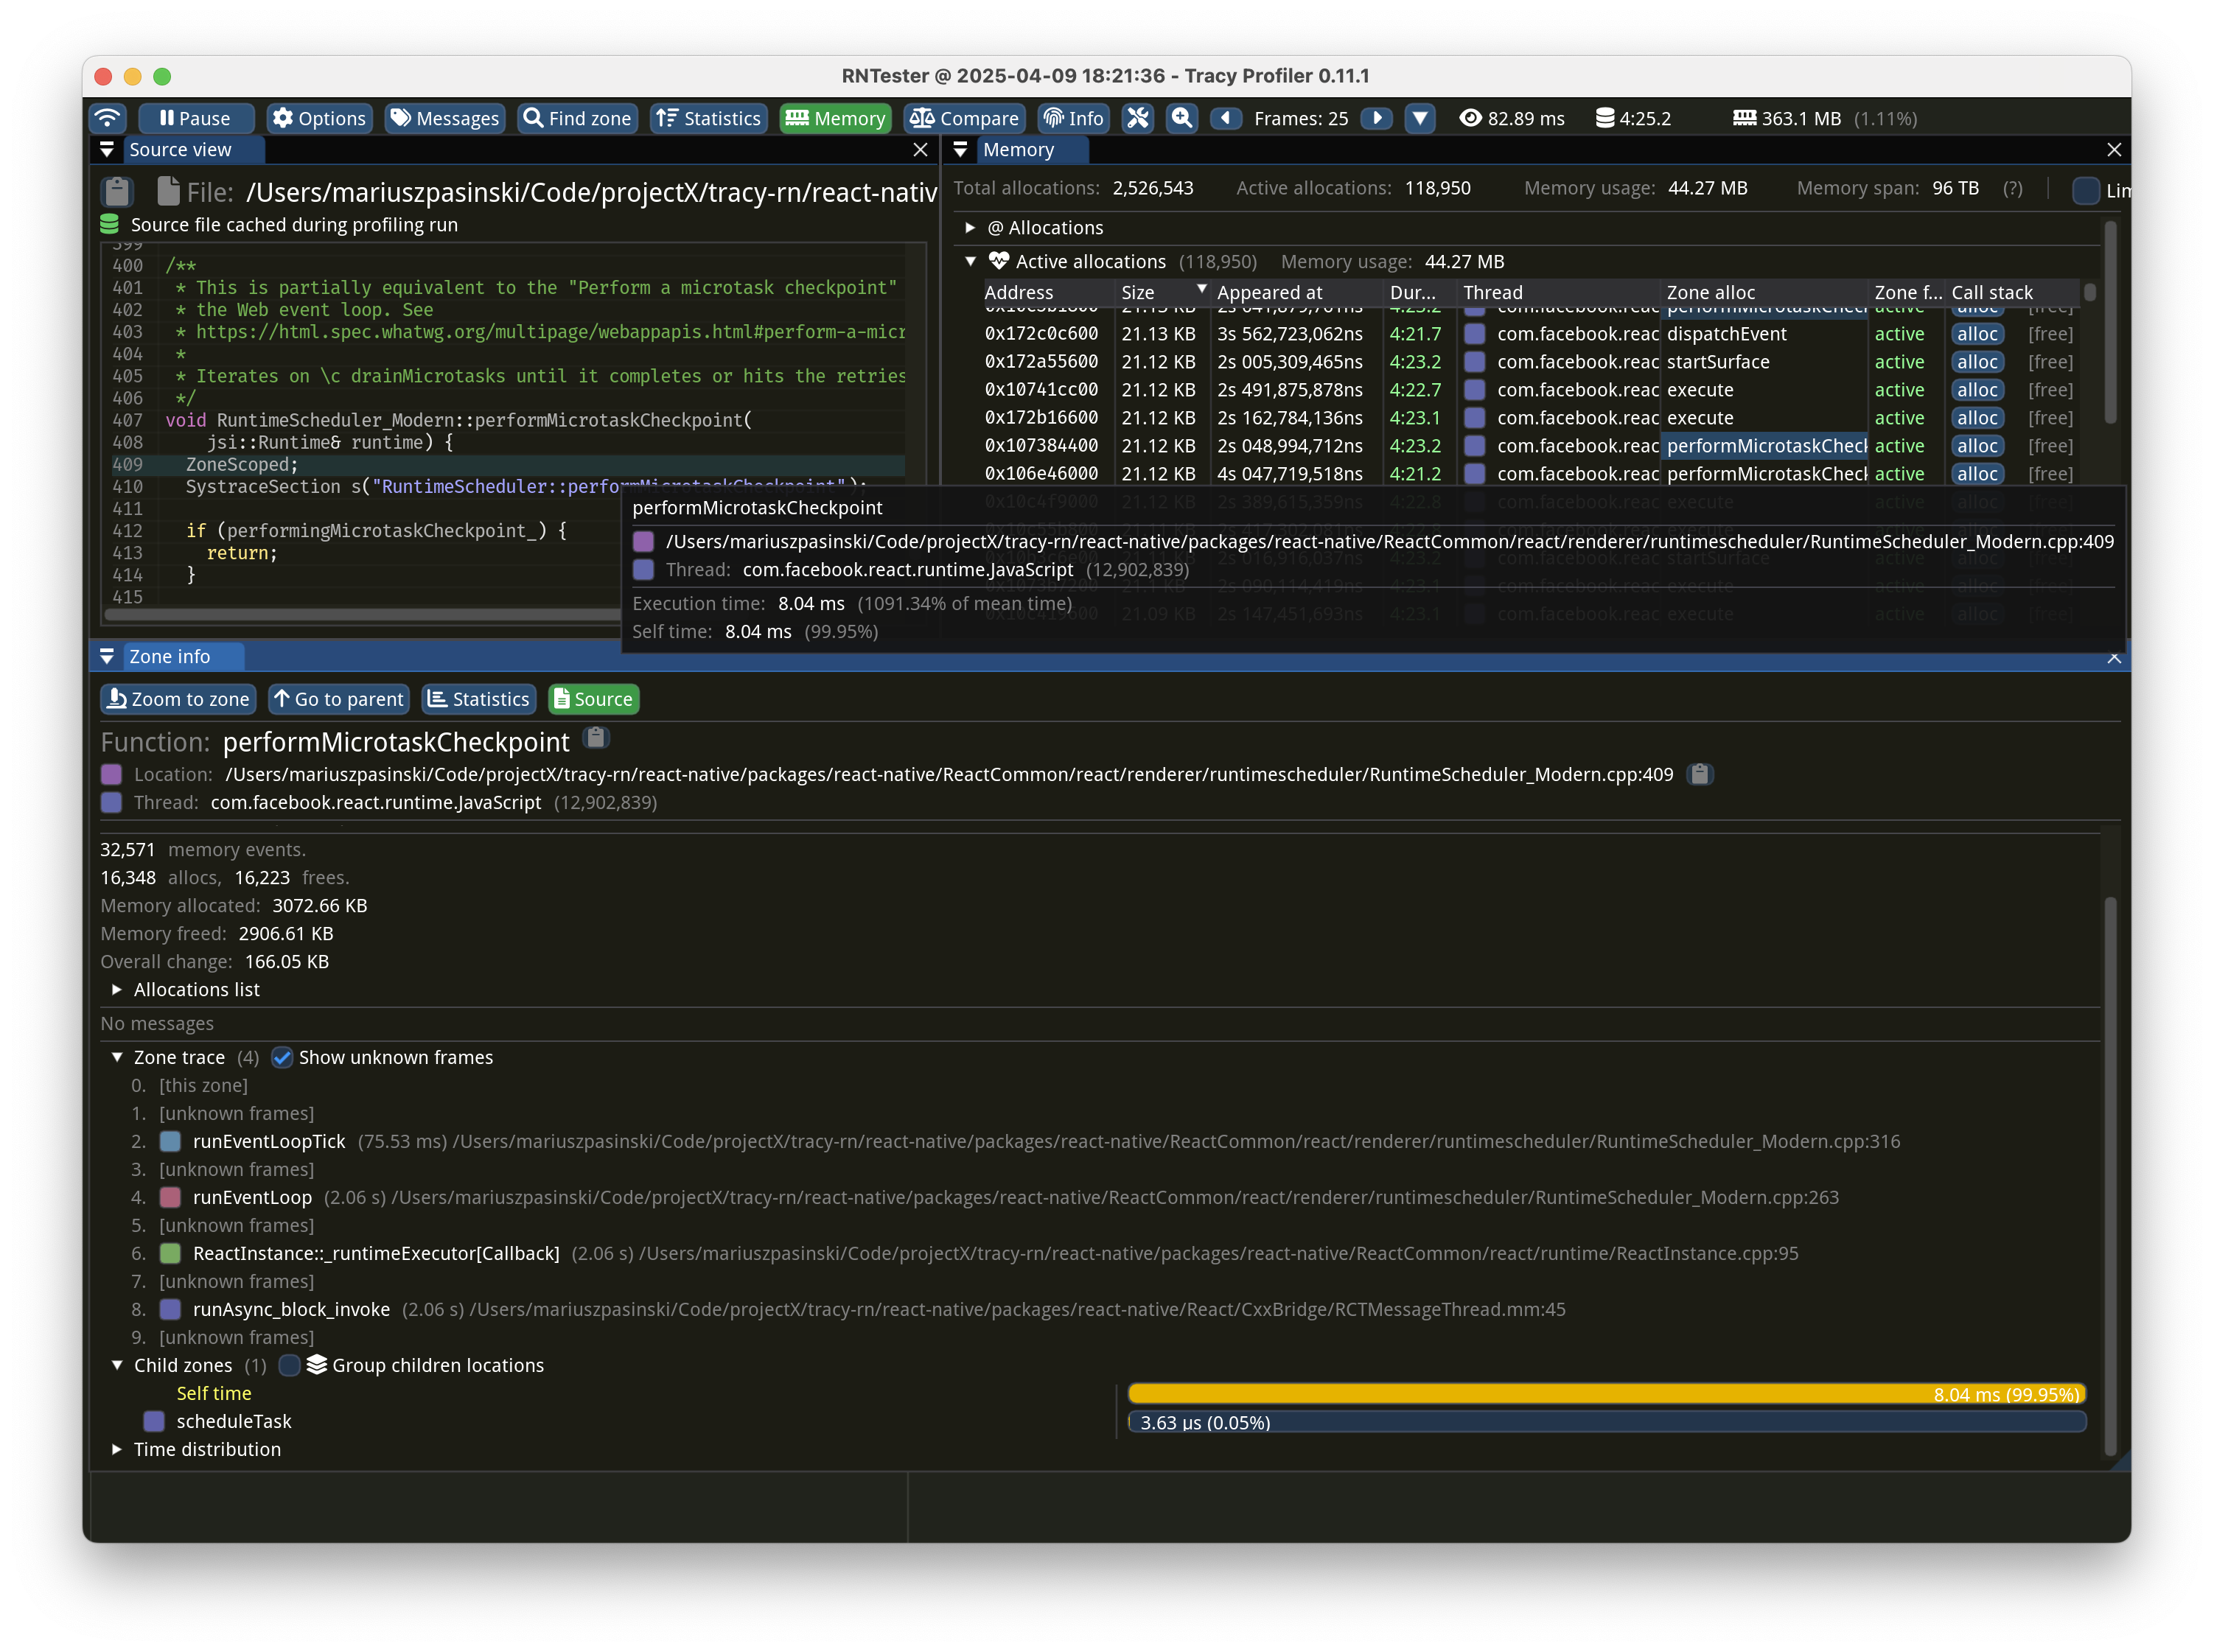
Memory allocations
I would like to start this section by posting a screenshot:
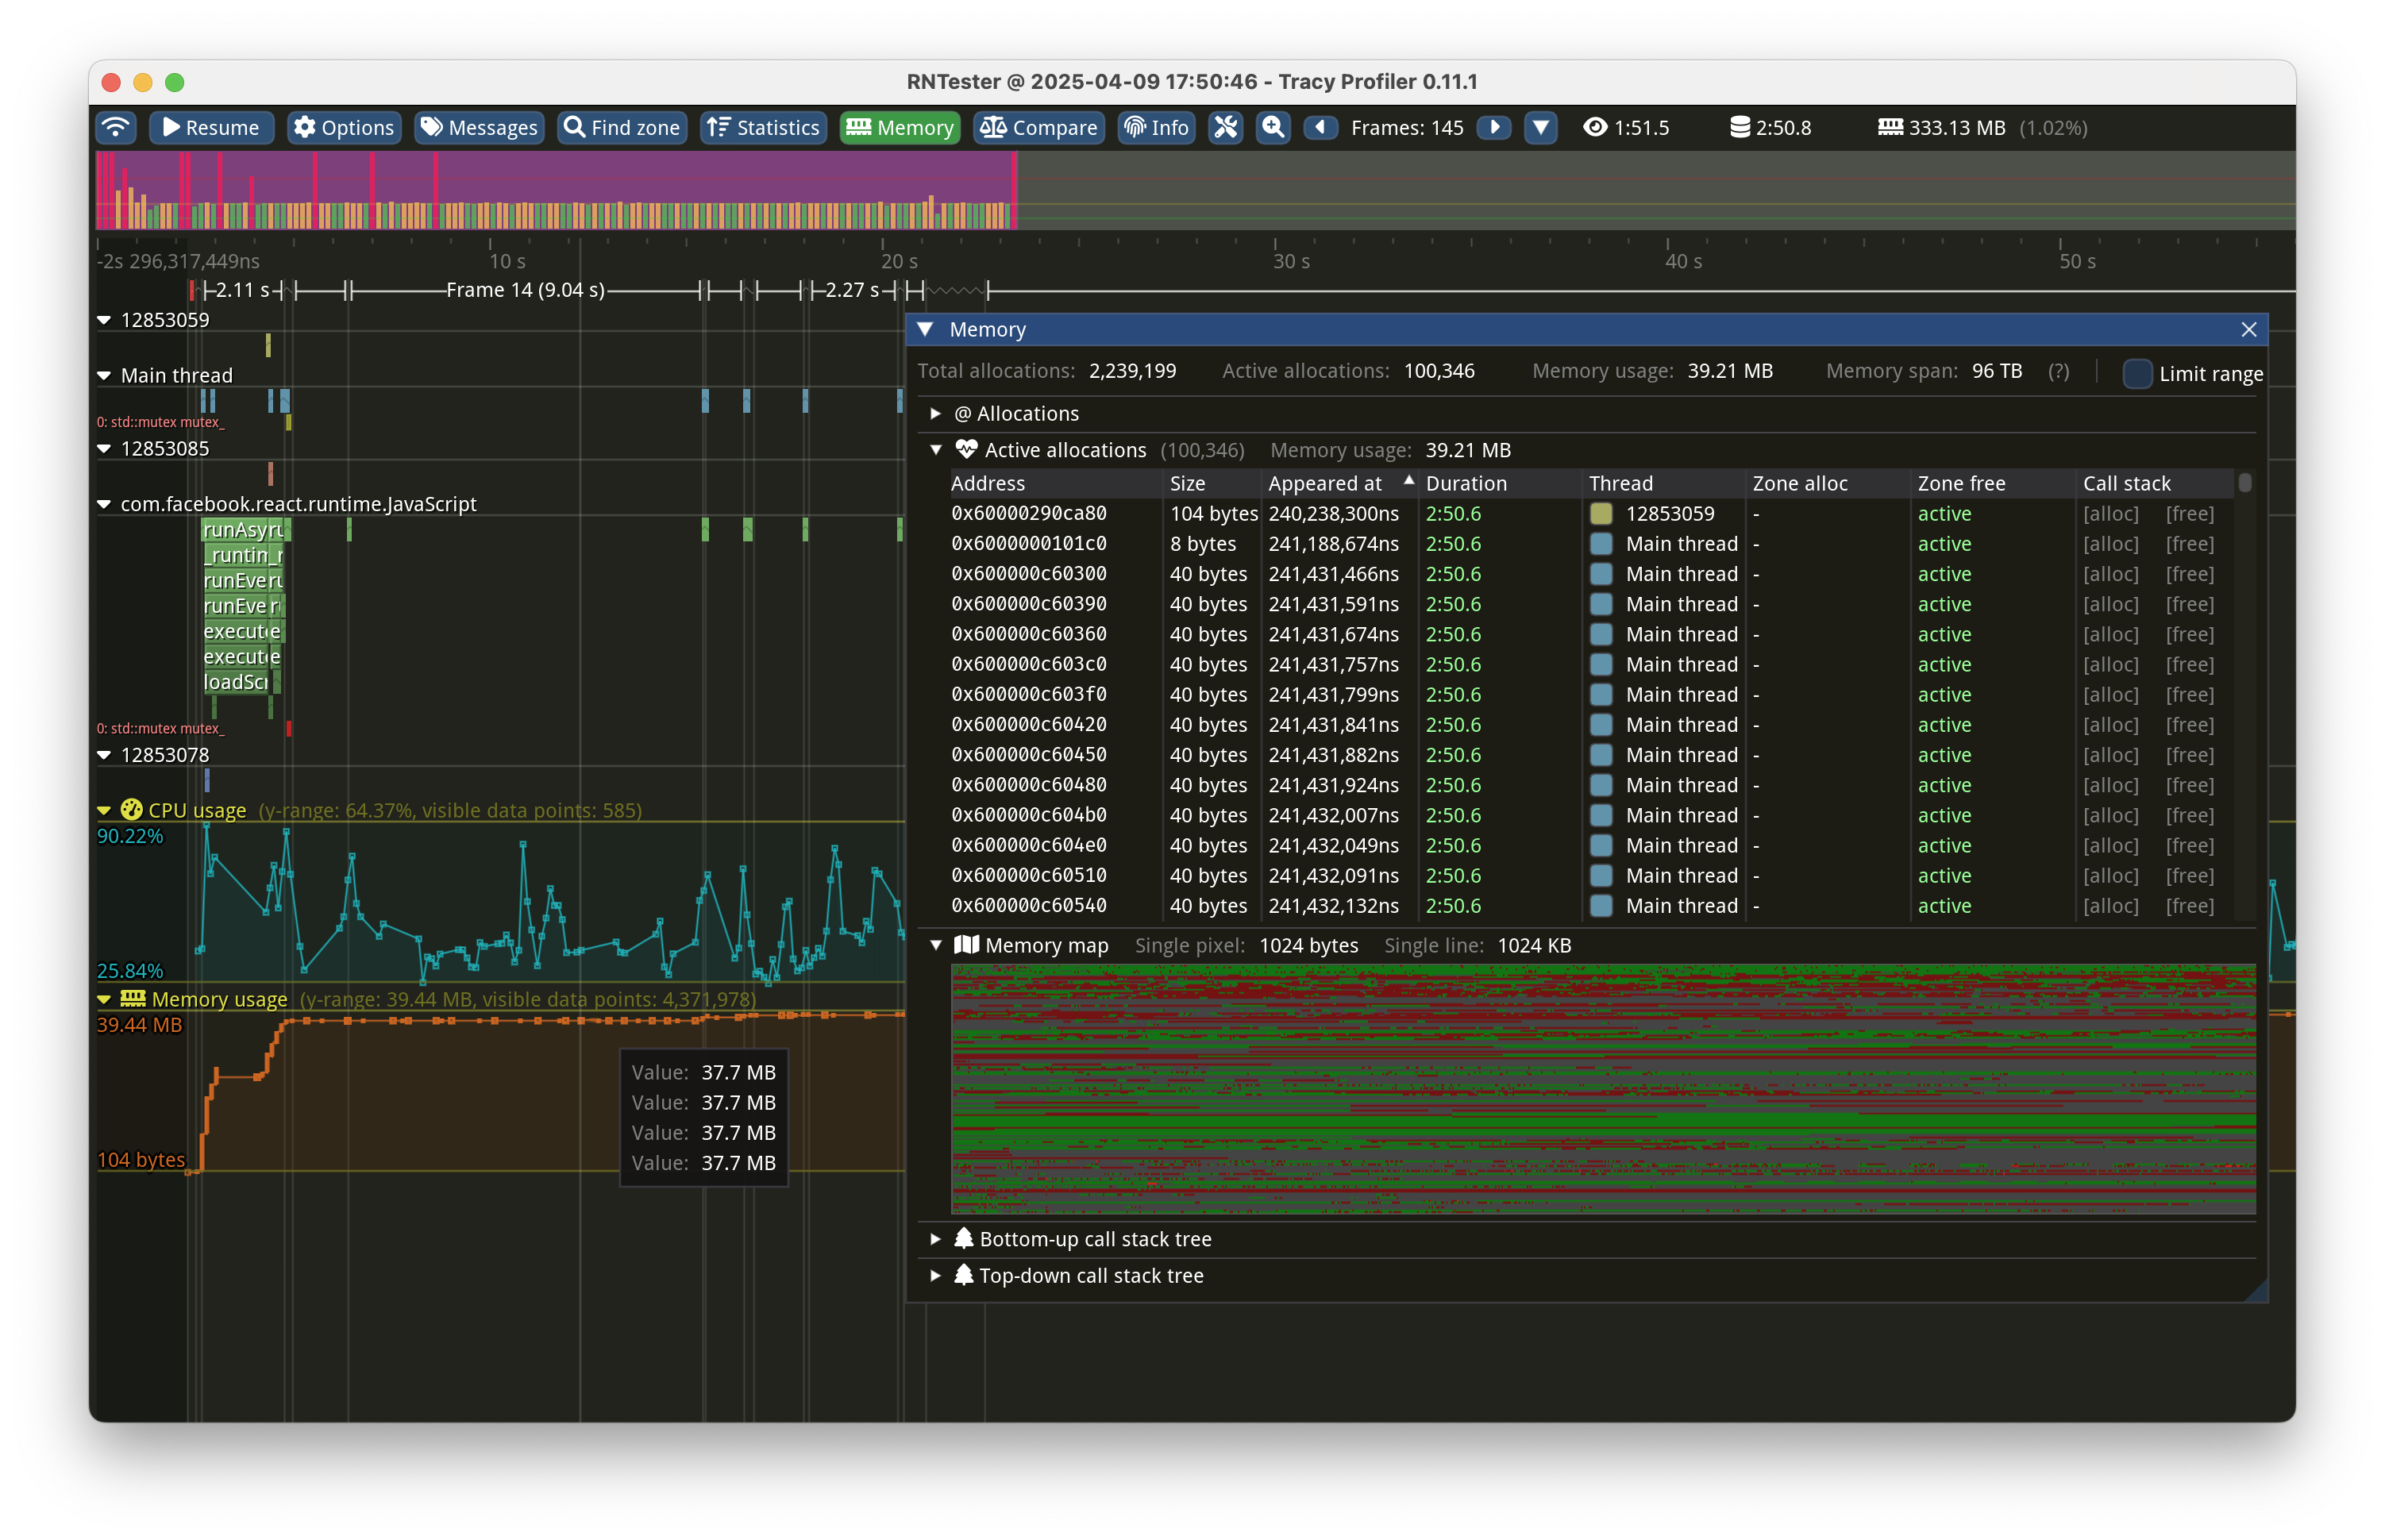
Not only does Tracy profiler graph how much memory was allocated (in my screenshot, it’s the orange graph at the bottom), but actually it tracks every single allocation and deallocation. This allows Tracy to list all active allocations and helps you spot memory leaks. For those of you who come from the embedded world and wrote something before MMU and virtual memory were put everywhere, this can also help you spot heap fragmentation. Honestly, how cool is that?
All I had to do was to override the global new and delete operators, as described in Tracy’s documentation (Section 3.8 “Memory profiling”):
Back in the day, when you wanted to track your memory allocations, you had to expose at least two macros—one for allocation and another for releasing memory—which would also smuggle the name of the source file (__FILE__) and line number (__LINE__). This allowed you to identify who allocated the “leaked” memory.
You can also use the TracyAllocS and TracyFreeS variants that will collect the stacks for you, so that you can pinpoint whose fault it is!
This is where everything fits together! Once you tell Tracy profiler about your threads and memory allocations and have enough scopes, spotting performance issues becomes a breeze. Allocations will be automatically linked to zones and threads, and you’ll be able to preview the source code. Everything in one tool for React Native profiling!
That’s all folks! We quickly skimmed through, in my opinion, the most important features of Tracy in the context of profiling React Native’s code itself! I highly recommend checking out the official documentation—it’s heavily packed with a lot of great content. You can grab it here (yep, it’s a PDF for download). Until next time!


Learn more about Performance
Here's everything we published recently on this topic.