How to Debug Faster and Better with Flipper

The debugging process is one of the most important elements of mobile app development. But, as you probably know, this process can be time-consuming and may not be the most enjoyable part of your work if it's not managed well. In this article, we will tell you how to make the debugging process faster, better, and more enjoyable.
What are the challenges in debugging?
Debugging is one of the more challenging parts of every developer’s daily work and finding out what is wrong can be very frustrating. We usually try to fix bugs as soon as possible, especially when they are critical and make an app unfunctional. Time is an important factor in that process and we usually have to be agile to quickly solve the issues.
However, debugging React Native is not very straightforward as the issue you are trying to solve may occur on different levels. Namely, it may be caused by:
- JavaScript: your application’s code or React Native, or
- Native code: third-party libraries or React Native itself.
Debugging native code and JavaScript code
When it comes to debugging native code, you have to use the tools built into Android Studio and Xcode. And when it comes to debugging JavaScript code, you may encounter several difficulties. The first and most “naive” way to debug is to write console.logs in your code and check logs in the terminal. This method works only for solving trivial bugs or when following the divide and conquer technique. In all other cases, you may need to use an external debugger.
By default, React Native ships with built-in debugging utilities.
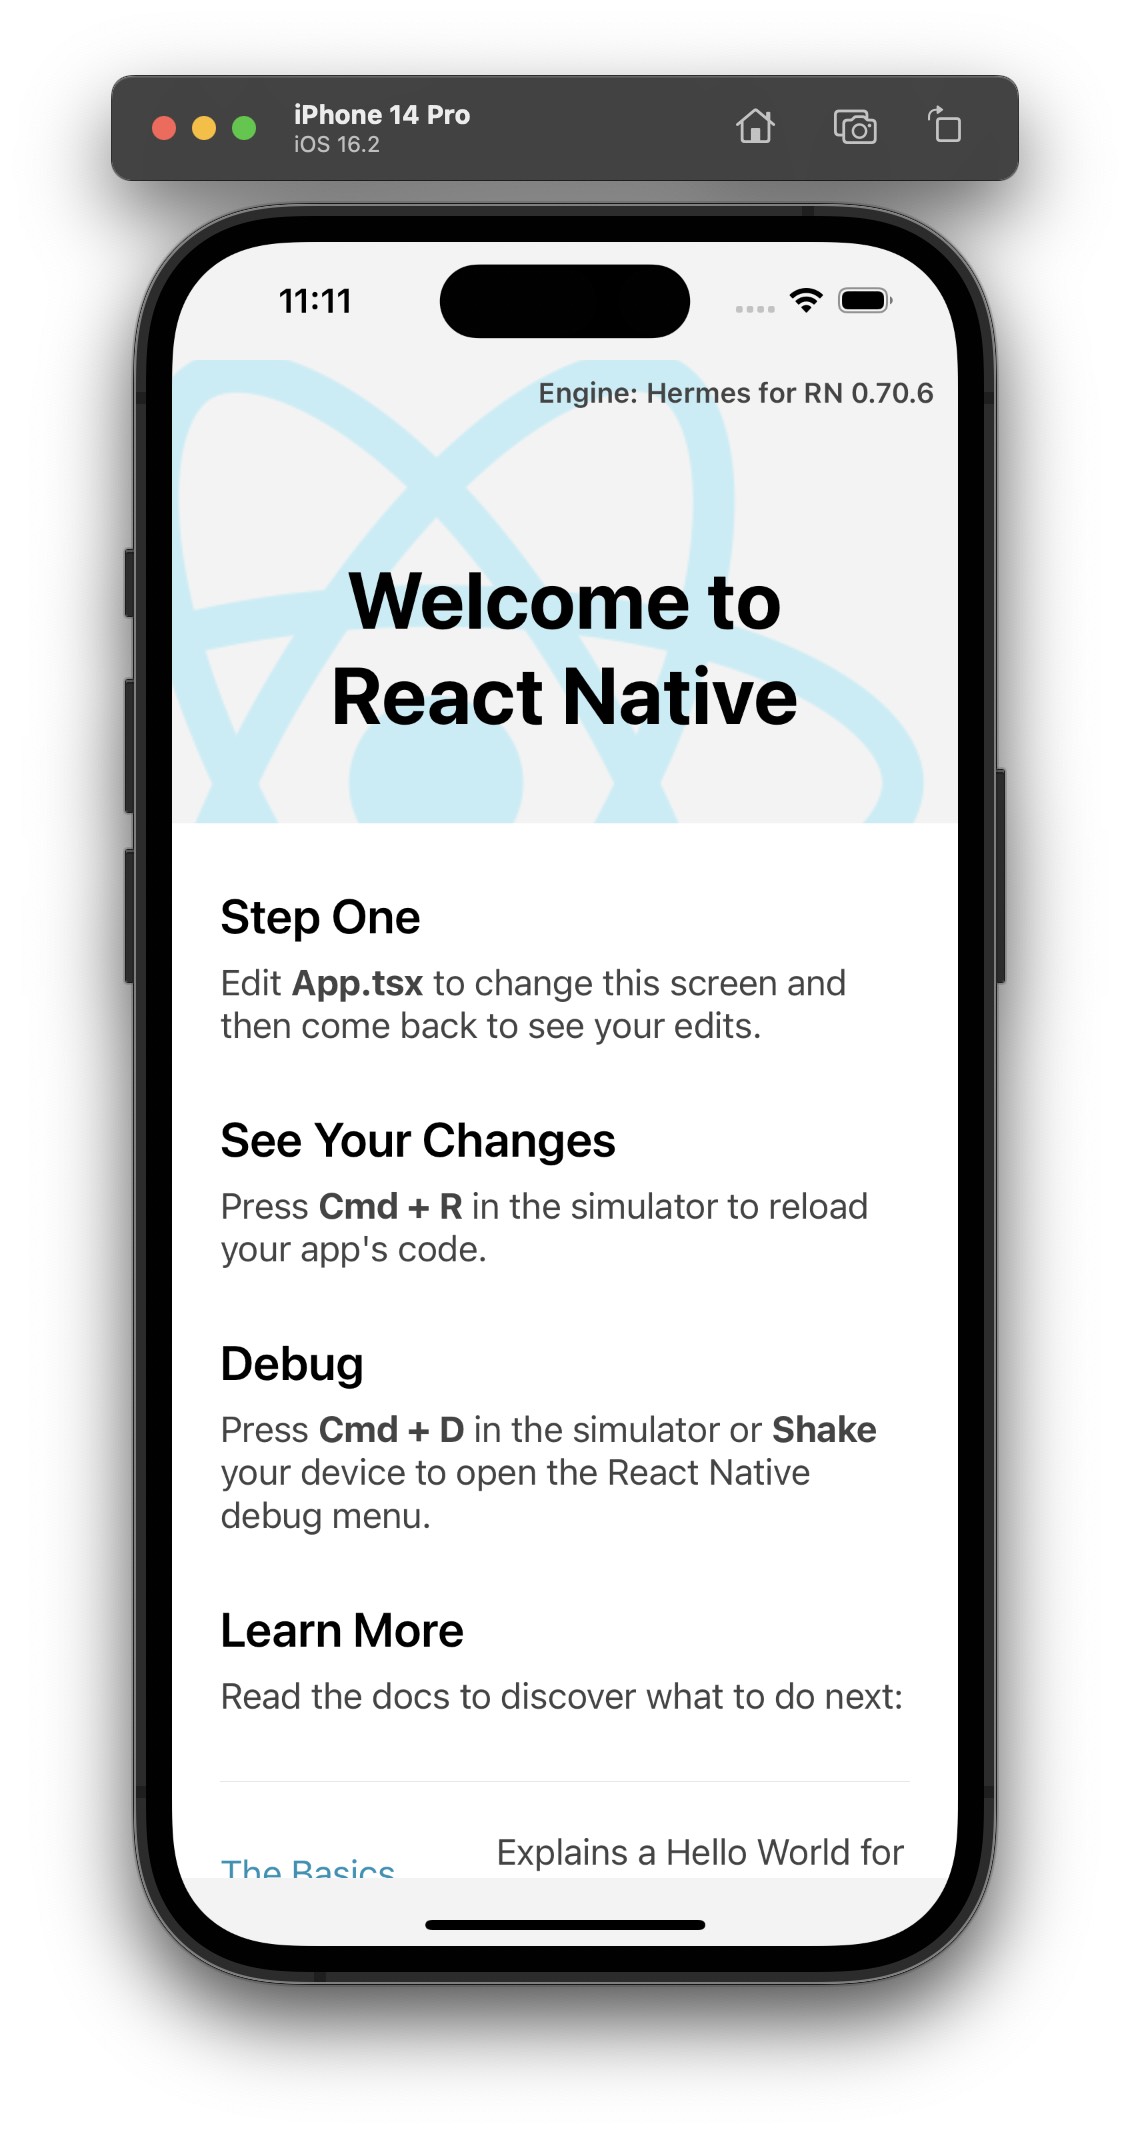
The most common one is the Google Chrome Remote Debugger. It allows you to set breakpoints in your code or preview logs in a handier way than in a terminal. Unfortunately, using the RemoteDebugger may lead to hard-to-spot issues. It’s because your code is executed in Chrome’s V8 engine instead of a platform-specific engine, such as JSC or Hermes.
The instructions generated in Chrome are sent via Websocket to the emulator or device. It means that you cannot use the debugger to profile your app so it detects the performance issues. It can give you a rough idea of what might cause the issues, but you will not be able to debug the real cause due to the over head of WebSocket message passing.
Another inconvenience is the fact that you cannot easily debug network requests with the Chrome Debugger (it needs additional setup and still has its limitations). In order to debug all possible requests, you have to open a dedicated network debugger using the emulator’s developer menu. However, its interface is very small and inconvenient due to the size of the emulator’s screen.
From the developer menu, you can access other debugging utilities, such as layout inspector or performance monitor. The latter is relatively convenient to use as it displays only a small piece of information. However, employing the former is a struggle because of the limited workspace it provides.
Longer debugging means worse developer experience
Unlike native developers, the ones working with React Native have access to a wide range of debugging tools and techniques. Each originates from a different ecosystem, such as iOS, Android, or JS. While it may sound great at first, you need to remember that every tool requires a different level of expertise in the native development. That makes the choice challenging for the vast majority of JavaScript developers.
Inconvenient tooling usually decreases the velocity of the team and frustrates its members. As a result, they are not as effective as they could be, affecting the quality of the app and making the releases less frequent.
Turn on Flipper to debug faster and better
Wouldn’t it be great to have one comprehensive tool to handle all those use cases? Of course, it would! And that’s where Flipper comes into play!
Flipper is a debugging platform for mobile apps. It also supports React Native as its first-class citizen. Launched in September 2019, Flipper has been shipped by default with React Native since version 0.62.
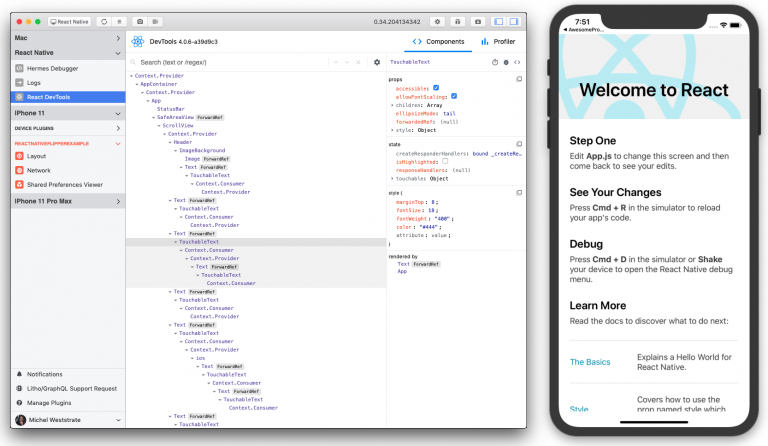
It is a desktop app with a convenient interface, which directly integrates with your application’s JS and native code. This means that you no longer have to worry about JS runtime differences and the performance caveats of using the Chrome Remote Debugger. It comes with a network inspector, React DevTools, and even a native view hierarchy tool.
Also, Flipper lets you preview logs from native code and track native crashes, so you don’t have to run Android Studio or Xcode to check what is happening on the native side.
Flipper is easily extensible, so there is a high chance it will be enriched with a wide range of useful plugins developed by the community. At this point, you can use Flipper for tasks such as detecting memory leaks, previewing the content of Shared Preferences, or inspecting loaded images. Additionally, Flipper for React Native is shipped with React DevTools, Hermes debugger, and Metro bundler integration.
What’s most exciting is that all the needed utilities are placed in one desktop app. That minimizes context switches. Without Flipper, a developer debugging an issue related to displaying the data fetched from the backend had to use Chrome debugger (to preview logs), an in-emulator network requests debugger, and probably an in-emulator layout inspector or standalone React Dev tools app. With Flipper, all those tools are available as built-in plugins. They are easily accessible from a side panel and have similar UI and UX.
Enjoy better feedback loop with Flipper
A better debugging process makes your app development cycle faster and more predictable. As a result, your team can produce more reliable code and spot any kind of issues much easier.
Having all debugging utilities in one interface is definitely ergonomic and does not disrupt any interactions with an emulator or device. The process will be less burdensome for your team and that will positively impact the velocity of the product development and bug fixing.
"Feel like a functionality is missing in Flipper? Good news! Flipper is easily extensible and has a comprehensive guide on how to write custom plugins in React. Why not build your own?"
Alexandre Moureaux – App performance specialist at BAM
Need help with performance?
If you’re struggling with improving your app performance, get in touch with us. We’re the official Meta and Vercel partners and active contributors to the community. We’ve delivered high-quality solutions for dozens of international clients, from startups to enterprises. Whatever React Native development needs your organization might have, we’ve got you covered.
Learn more about
Developer Experience
Here's everything we published recently on this topic.


We can help you move
it forward!
At Callstack, we work with companies big and small, pushing React Native everyday.
React Native Performance Optimization
Improve React Native apps speed and efficiency through targeted performance enhancements.
Super App Development
Turn your application into a secure platform with independent cross-platform mini apps, developed both internally and externally.
Mobile App Development
Launch on both Android and iOS with single codebase, keeping high-performance and platform-specific UX.
React Development
Develop high-performance React applications with advanced patterns and scalable architectures.